DESIGN PROCESS

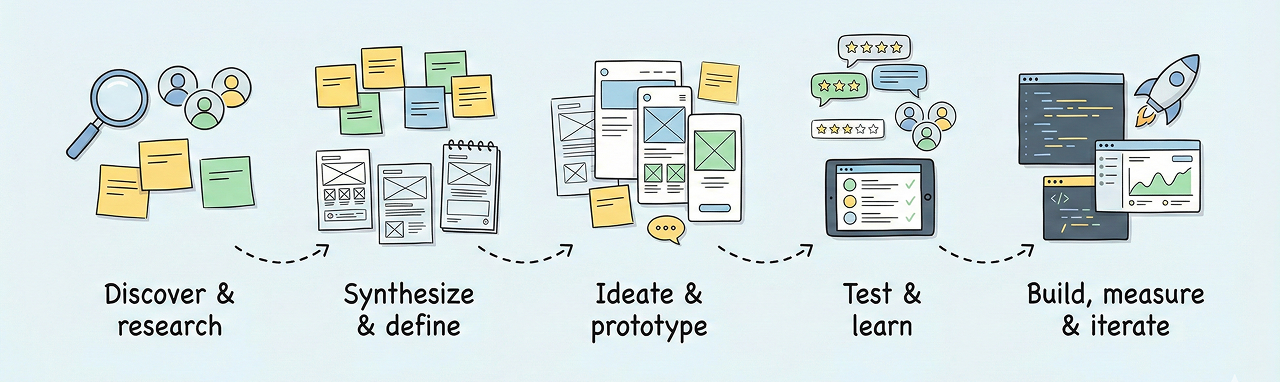
Process visualization

Discovery and story mapping

I start by clarifying the user need, business goal, and implementation constraints.

Depending on the problem, I speak with users, clients, customer support, product managers, and engineers.

Journey maps, story maps, and flow charts are useful when they improve shared understanding. I do not create them by default—the goal is clarity, not a prescribed set of deliverables.

Ideation and prototyping

I usually begin with notes and paper sketches. Once the direction is clear, I choose the fastest medium that can answer the next product question.

For established product work, that may be Figma. For new projects, I usually implement the frontend with Codex and refine the working interface in the browser.

Day-to-day process

In practice, the process is a short loop: understand the need, sketch the solution, build the smallest useful version, get feedback, and iterate.

On an established product, that loop may include Figma. On new projects, it runs mostly through paper, code, and the browser. The rigor is the same; the medium changes.

Lean

I apply Lean principles whenever possible: test quickly, validate the solution, and iterate.

Often, user needs can be met with a simple interface and lightweight solution. AI-assisted implementation reduces the cost of functional prototypes, so I can test behavior and edge cases earlier. At every stage I ask, “Can we make this simpler and faster?”

Choosing the medium

I do not treat any design tool as a required stage. Paper is best for thinking without tool friction.

Figma is useful when a shared visual source of truth matters. Code is better when the main questions concern behavior, real data, responsiveness, or implementation feasibility.

For new projects, the loop is paper → Codex → browser → test → iterate. The principle is simple: minimize the distance between a product decision and evidence that it works.

Tools in context

Current workflow: paper, Codex, browser, HTML, CSS, JavaScript, Tailwind.

Established product work: Figma, Notion, Jira, YouTrack, Miro, Whimsical.

Research and analytics: FullStory, Microsoft Clarity, Hotjar, PostHog, Pendo, Heap, Google Analytics.

Previous design tools: Axure ↗, Sketch, Framer, Adobe XD, Balsamiq, Photoshop, ProtoPie.

Application building: Bubble, Airtable, Supabase, Oracle APEX, OutSystems, Caspio, WaveMaker.

WHAT I LIKE

Complex tasks

This is what makes design so engaging. You start with a need, define the goal, and work toward a solution.

Unlike many roles that deal with repetitive problems, design often presents challenges with no obvious answer. Those situations require deeper thinking, exploration, and iteration. That’s one reason I focus on SaaS B2B products—they typically involve complex problems that demand thoughtful solutions.

Data visualizations

Through multiple data-centric projects, I’ve seen how impactful visualization can be. For business-oriented charts, I follow the International Business Communication Standards ↗ (IBCS)—a practical rulebook for clear, concise charts.

For discovery and insight, more sophisticated plots are sometimes needed. I’ve worked with tools ranging from Excel and PowerBI to Highcharts and amCharts.

Visualizations don’t always require chart libraries. For one project, we added an in-cell bar column to give users an instant sense of distribution. In another, we built a bubble chart directly in HTML for faster performance and fully custom tooltips.

Many products underuse visualization. Too often, users face raw data tables that are hard to interpret when a simple chart would make patterns clear.

AI-assisted implementation

AI is now part of my implementation workflow, not only a research or ideation assistant.

For new projects, I use Codex to turn paper sketches and product constraints into working frontend features. I test states and edge cases in the browser, then refine the result. The speed comes from the tool; the product decisions remain mine.

SIDE PROJECTS

Why it's important

I’ve been building side projects since 2006. They let me experiment, learn, and understand the mechanics behind design.

Beyond project management experience, I’ve become familiar with technologies I might never have encountered otherwise.

These projects taught me how systems work and gradually moved my practice closer to design engineering.

Hymetry

Hymetry ↗ began as a “what if” idea: what if session recording went beyond heatmaps and playback to show how users move across pages, tabs, and flows?

For Hymetry, I no longer create a complete Figma design before building a feature. I sketch it on paper, define the behavior and important states, then implement the frontend with Codex and iterate in the browser.

For many features, the prototype and implementation are the same artifact. This workflow has taught me to design within real constraints: recording behavior, privacy masking, multi-tab synchronization, backend performance, and dense analytics interfaces.

Treenga

Treenga was my attempt to rethink task management. Rigid hierarchies and endless boards felt heavy; I wanted something lighter—where priorities and context were clear without clutter.

It taught me that simplicity is hard. Many “must-have” features became distractions in daily use. Stripping down was tougher than adding more, but far more effective.

The deeper lesson was about product mechanics: how people structure work, what “priority” means in practice, and why clarity often beats flexibility.

UpcomingEvents MacOS app

This project started from a small annoyance: constantly switching to the calendar to check what’s next. The idea—show upcoming events right in the dock icon—reduced friction and kept focus.

It wasn’t just UI polish. I had to handle system integrations, real-time updates, and performance so it stayed lightweight and unobtrusive.

The lesson: meaningful value can come from solving small, recurring pain points. Subtle, well-placed cues can make a big difference—especially when they respect platform conventions and blend in naturally.